
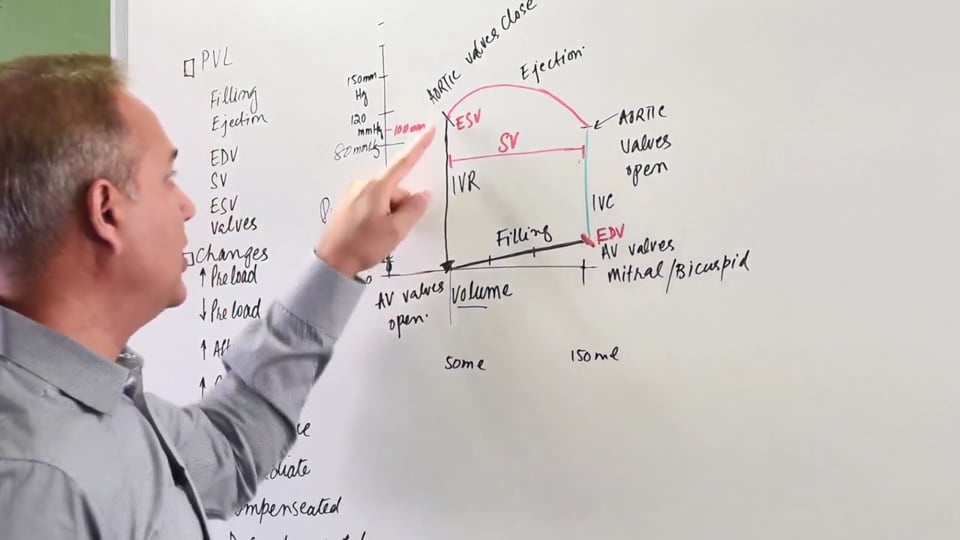
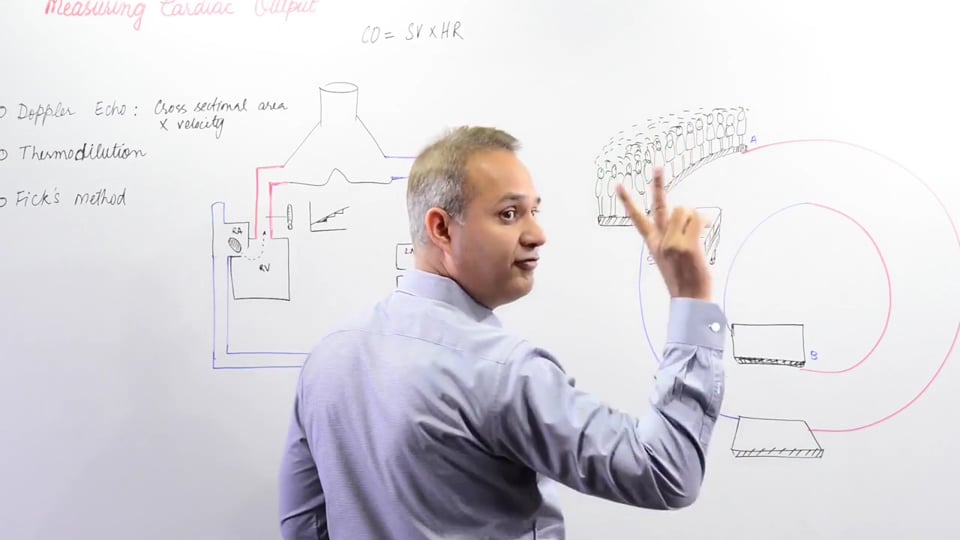
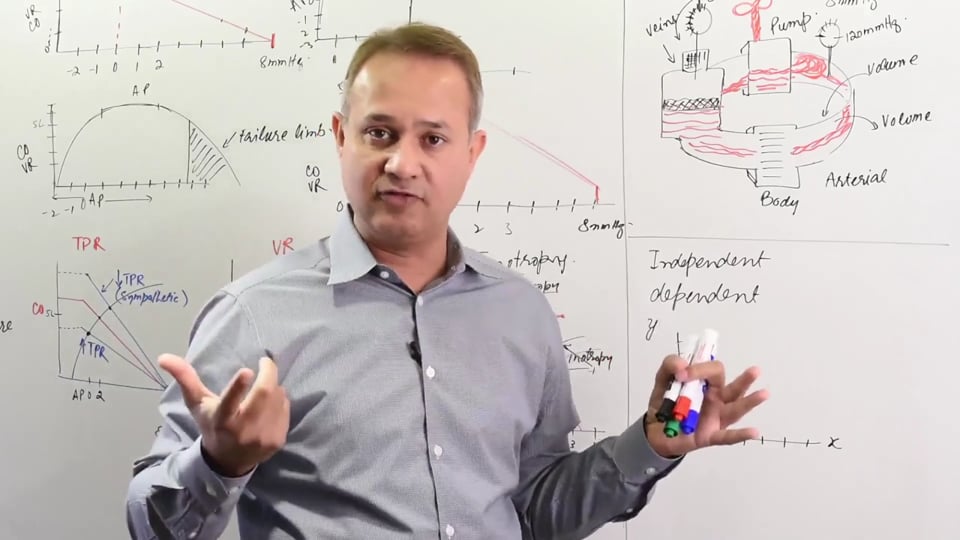
This video presents: Vascular function curve/graph Cardiac function curve/graph We will combine the two graphs and understand how to approach it in the exams. We will also see the effects of: Inotropy changes Venous return changes Total peripheral resistance changes We will also explain the difference between: Mean systemic pressure Mean circulatory pressure
In this video we will learn about :
1. Vascular function curve.
2. Cardiac function curve.
3. Combined cardiovascular graph.
4. Effect of ionotropy changes on curves.
5. Effect of TPR on curves.
6. Effect of venous return changes on curves.
7. Mean systemic and circulatory pressures.
Following answers are created by ChatGPT. Occasionally the answer may be harmful, incorrect, false, misleading, incomplete, or limited in knowledge of world. Please contact your doctor for all healthcare decisions. Also, double check the answer provided by the AI below.
In addition to the presenter, following authors may have helped with the content writing, review, or approval:
ACCME Accreditation Statement
The DrBeen Corp is accredited by the Accreditation Council for Continuing Medical Education (ACCME) to
provide continuing medical education for physicians.
AMA Credit Designation Statement
The DrBeen Corp designates this enduring material for a maximum of 0.75 AMA PRA Category 1
Credits™.
Physicians should claim only the credit commensurate with the extent of their participation in the
activity.
In accordance with the disclosure policies of DrBeen Corp and the ACCME (Accreditation Council for
Continuing Medical Education), we are committed to upholding principles of balance, independence,
objectivity, and scientific rigor in all of our Continuing Medical Education (CME) and Continuing
Education (CE) activities. These policies include the careful management and mitigation of any relevant
financial relationships with organizations that are not eligible.
All members of the Activity Planning Committee and presenters have disclosed their relevant financial
relationships. The DrBeen Corp CE Committee has thoroughly reviewed these disclosures and determined
that these relationships are not deemed inappropriate in the context of their respective presentations.
Additionally, they are found to be consistent with the educational objectives and the integrity of the
activity.
| Faculty | Disclosures |
|---|---|
| Dr. Mobeen Syed | Author declares no conflict of interest. |

MD., MSc., MSc., BSc
Mobeen Syed is the CEO of DrBeen Corp, a modern online medical education marketplace. Mobeen is a medical doctor and a software engineer. He graduated from the prestigious King Edward Medical University Lahore. He has been teaching medicine since 1994. Mobeen is also a software engineer and engineering leader. In this role, Mobeen has run teams consisting of hundreds of engineers and millions of dollars of budgets. Mobeen loves music, teaching, and doing business. He lives in Cupertino CA.

Luis A Verduzco M.D.
Luis A Verduzco M.D.
Ahmed Zaafran, MD
 1.25 CME
Luis A Verduzco M.D.
Ahmed Zaafran, MD
 0.50 CME
Tatyana Travkina, MD
Ahmed Zaafran, MD
Ahmed Zaafran, MD
Ahmed Zaafran, MD
 0.75 CME
Tatyana Travkina, MD
Ahmed Zaafran, MD
Tatyana Travkina, MD
Ana Crawford M.D., M.Sc.
Ahmed Zaafran, MD
Ahmed Zaafran, MD
Ahmed Zaafran, MD
 1.25 CME
Dr. Mobeen Syed
Ahmed Zaafran, MD
 0.12 CME
Dr. Mobeen Syed

Ahmed Zaafran, MD
 1.25 CME
Dr. Mobeen Syed
Dr. Mobeen Syed
Dr. Mobeen Syed
 0.50 CME
Dr. Mobeen Syed
 0.75 CME
Dr. Mobeen Syed

Ahmed Zaafran, MD
 0.25 CME
Dr. Mobeen Syed
 0.16 CME
Dr. Mobeen Syed
 0.50 CME
Dr. Mobeen Syed
 0.16 CME
Dr. Mobeen Syed
Dr. Mobeen Syed
Dr. Mobeen Syed
 0.75 CME
Dr. Mobeen Syed
 0.50 CME
Dr. Mobeen Syed
 0.20 CME
Dr. Mobeen Syed
 0.20 CME
Dr. Mobeen Syed
 0.12 CME
Dr. Mobeen Syed
 0.09 CME
Dr. Mobeen Syed
 0.24 CME
Dr. Mobeen Syed
 0.25 CME
Dr. Mobeen Syed
 0.19 CME
Dr. Mobeen Syed
 0.08 CME
Dr. Mobeen Syed
 0.11 CME
Dr. Mobeen Syed
 0.09 CME
Dr. Mobeen Syed
 0.50 CME
Dr. Mobeen Syed
 1.00 CME
Dr. Mobeen Syed
 0.25 CME
Dr. Mobeen Syed
 0.50 CME
Dr. Mobeen Syed
 0.50 CME
Dr. Mobeen Syed
 0.50 CME
Dr. Mobeen Syed
 0.16 CME
Dr. Faraaz Bhatti
 0.50 CME
Dr. Mobeen Syed
 0.50 CME
Dr. Mobeen Syed
 0.50 CME
Dr. Mobeen Syed
 0.50 CME
Dr. Mobeen Syed
 0.18 CME
Dr. Mobeen Syed
 0.17 CME
Dr. Mobeen Syed
 0.50 CME
Dr. Mobeen Syed
 0.21 CME
Dr. Mobeen Syed
 0.21 CME
Dr. Mobeen Syed
 0.50 CME
Dr. Mobeen Syed
 0.25 CME
Dr. Mobeen Syed
 0.24 CME
Dr. Mobeen Syed
 0.50 CME
Dr. Mobeen Syed
 0.75 CME
Dr. Mobeen Syed
 0.50 CME
Dr. Mobeen Syed
 1.00 CME
Dr. Mobeen Syed
 0.75 CME
Dr. Mobeen Syed
 0.25 CME
Dr. Mobeen Syed
 0.08 CME
Dr. Mobeen Syed
 0.05 CME
Dr. Mobeen Syed
 0.12 CME
Dr. Mobeen Syed
 1.25 CME
Dr. Mobeen Syed
Dr. Mobeen Syed
Dr. Mobeen Syed
 0.50 CME
Dr. Mobeen Syed
 0.22 CME
Dr. Mobeen Syed
 0.50 CME
Dr. Mobeen Syed
 0.25 CME
Dr. Mobeen Syed
 0.13 CME
Dr. Mobeen Syed
 0.16 CME
Dr. Mobeen Syed
 0.16 CME
Dr. Mobeen Syed
 0.15 CME
Dr. Mobeen Syed
 0.15 CME
Dr. Mobeen Syed
 0.19 CME
Dr. Mobeen Syed
 0.75 CME
Dr. Mobeen Syed
 0.12 CME
Dr. Mobeen Syed
 0.16 CME
Dr. Mobeen Syed
 0.25 CME
Dr. Mobeen Syed
 0.24 CME
Dr. Mobeen Syed
 0.25 CME
Dr. Mobeen Syed
 0.19 CME
Dr. Mobeen Syed
 0.18 CME
Dr. Mobeen Syed
 0.50 CME
Dr. Mobeen Syed
 0.75 CME
Dr. Mobeen Syed
 0.50 CME
Dr. Mobeen Syed
 0.25 CME
Dr. Mobeen Syed
 0.50 CME
Dr. Mobeen Syed
 0.50 CME
Dr. Mobeen Syed
 0.25 CME
Dr. Mobeen Syed
 0.75 CME
Dr. Mobeen Syed
 0.13 CME
Dr. Mobeen Syed
 0.50 CME
Dr. Mobeen Syed
 0.25 CME
Dr. Mobeen Syed
0.50 CME
Dr. Mobeen Syed
 0.50 CME
Dr. Mobeen Syed
 0.50 CME
Dr. Mobeen Syed
 0.25 CME
Dr. Mobeen Syed
 1.00 CME
Dr. Mobeen Syed
 0.25 CME
Dr. Mobeen Syed
 0.20 CME
Dr. Mobeen Syed
 0.25 CME
Dr. Mobeen Syed
 0.17 CME
Dr. Mobeen Syed
 0.25 CME
Dr. Mobeen Syed
 0.50 CME
Dr. Mobeen Syed
 0.25 CME
Dr. Mobeen Syed
 0.19 CME
Dr. Mobeen Syed
 0.50 CME
Dr. Mobeen Syed
All information contained in and produced by DrBeen corp is provided for educational purposes only. This information should not be used for the diagnosis or treatment of any health problem or disease.
THIS INFORMATION IS NOT INTENDED TO REPLACE CLINICAL JUDGMENT OR GUIDE INDIVIDUAL PATIENT CARE IN ANY MANNER.
Click here for notice and disclaimer.

Write A New Comment
0 Comments